How to Use Task Analytics chart
You can use Task Analytics Chart to create various types of charts that visualize analytic data.
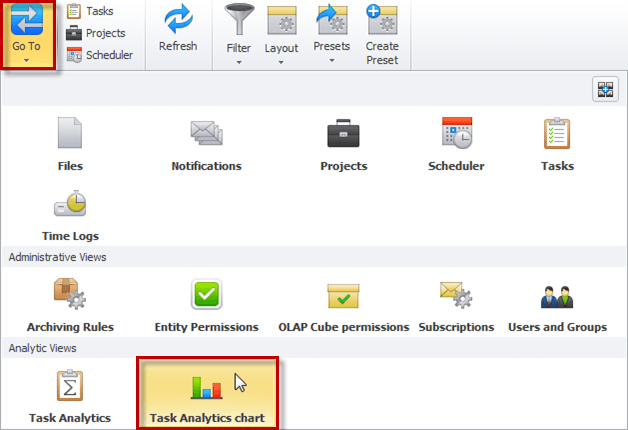
- To open the Task Analytics view, clickGo To, and then click Task Analytics Chart.
To set chart layout, on the ribbon, in the View group, click the Layout.
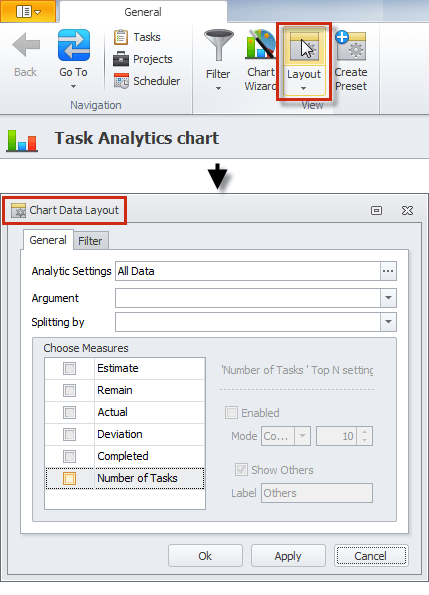
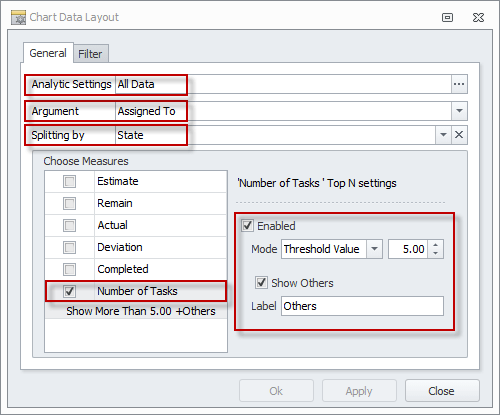
In the Chart Data Layout dialog box you can enter the following settings:
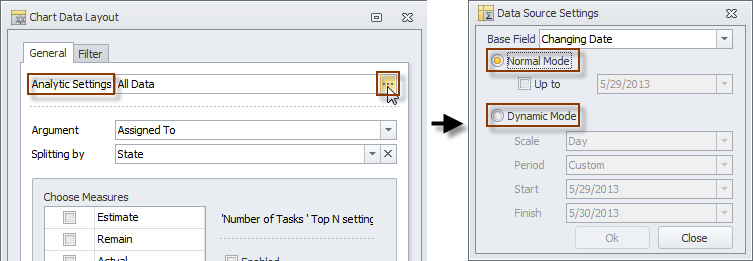
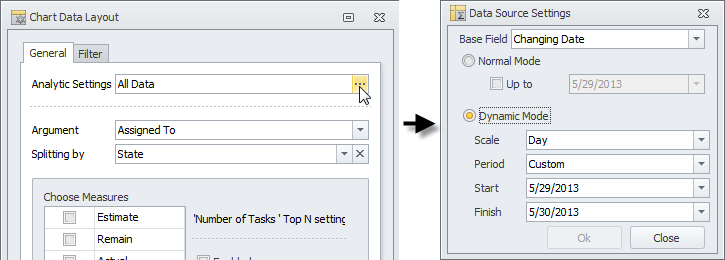
- Analytic Settings
Use the Normal mode to show all data or data saved from the beginning to a specific date. Use the Dynamic mode to show data for a certain period with a particular scale.
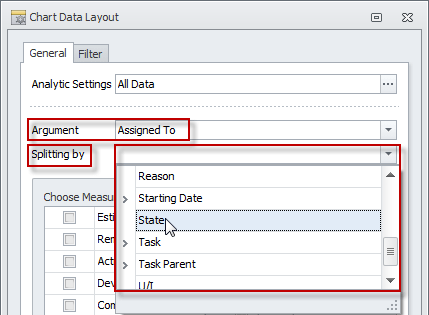
- Argument and Splitting by
Use the Argument option to choose the task property that will be show in the chart. Use the Splitting By option to choose the task property by which the Argument property will be divided.
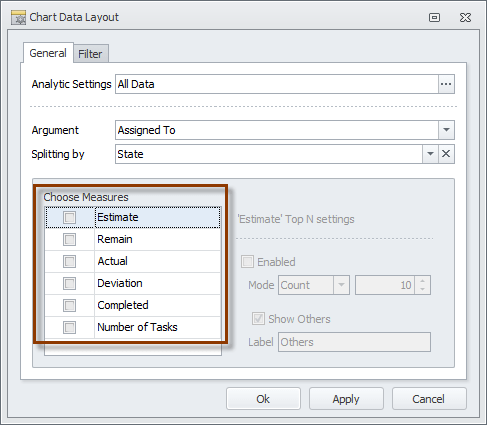
- Measures
Use the Measures list to choose the task properties by which the Argument property will be measured. Use Top N settings to limit the data that will be shown in the chart.
Tip Learn how to use Task Analytics.
Examples
You can learn how to use Task Analytics charts by studying the following examples:
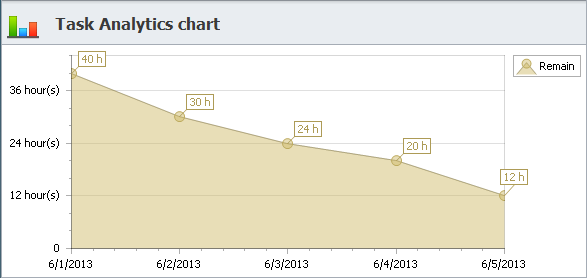
Project Burndown Chart
You can use Project Burndown Chart to analyze the time remaining till target completion date.
To create Project Burndown Chart
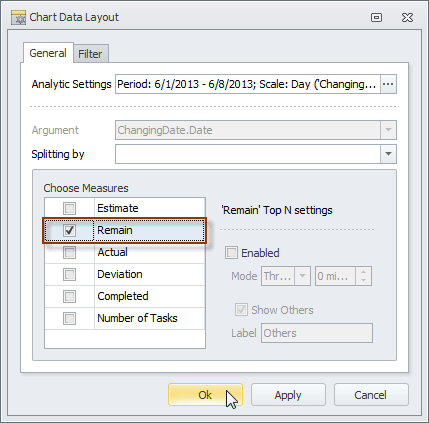
- In the Chart Data Layout pane, click ellipsis in the Analytics Settings box, and then in the Data Source Settings dialog box, select Dynamic Mode, enter required settings in the Scale, Period, Start, and Finish boxes, and then click OK.
- In the Chart Data Layout pane, select the Remain check box in the Choose Measures list, and then click OK.
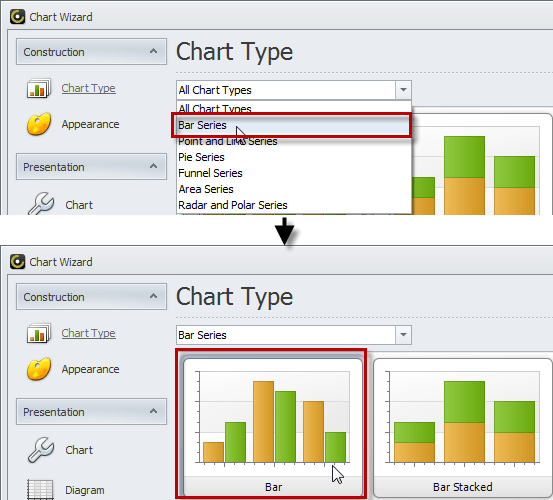
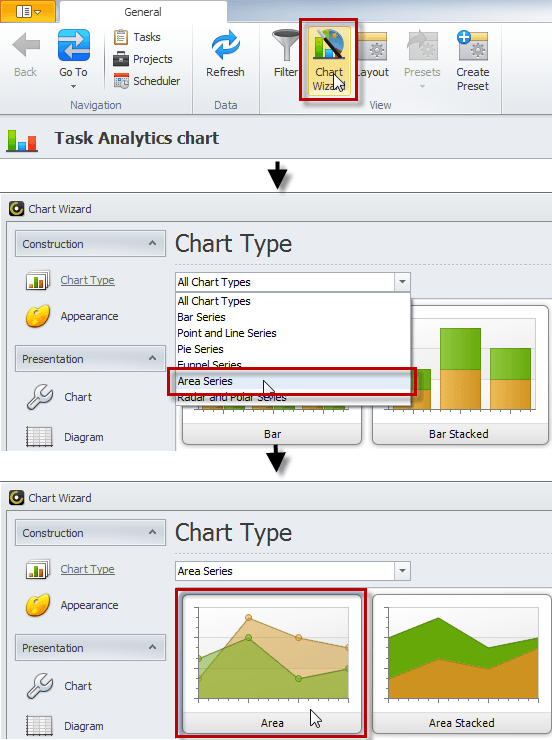
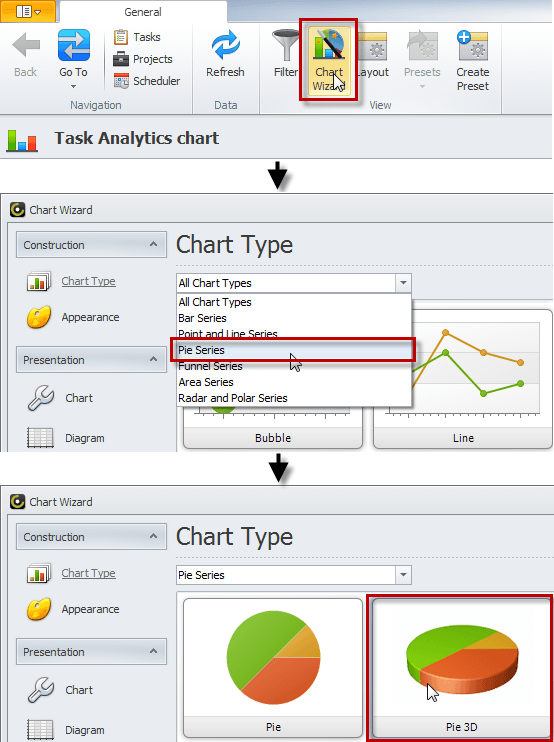
- On the ribbon, in the View group, click Chart Wizard, then in the Chart Wizard window, under Construction, click down-pointing triangle in the Chart Type list, click Area Series, and then click the Area chart.
Work Progress Chart
You can use Work Progress Chart to track and measure tasks of which your work consists.
To create Work Progress Chart
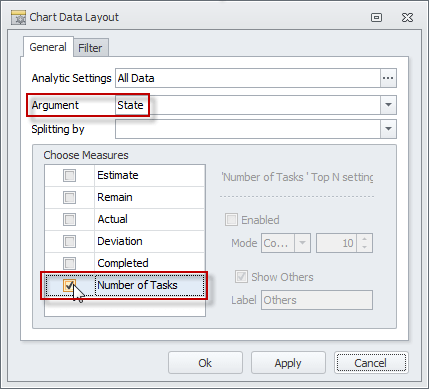
- In the Chart Data Layout pane, enter the following settings: Analytic Settings = All Data, Argument = State, Measure = Number of Tasks.
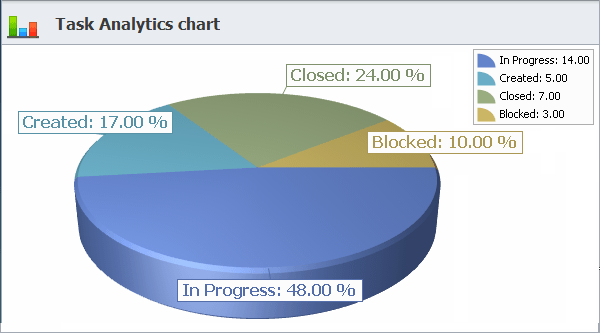
- On the ribbon, in the View group, click Chart Wizard, then in the Chart Wizard window, under Construction, click down-pointing triangle in the Chart Type list, click Pie Series, and then click the Pie 3D chart.
Top Employees Chart
You can use Top Employees Chart to show employees that closed more tasks then others.
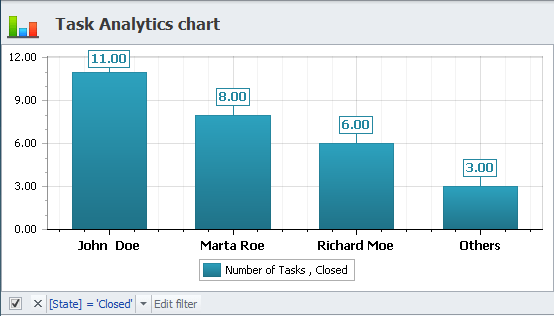
To create Top Employees Chart
- In the Chart Data Layout pane, enter the following settings: Analytic Settings = All Data, Argument = Assigned To, Measure = Number of Tasks, in the Top N settings, select the Enabled check box, click Threshold Value and enter 5 in the Mode field, and then select the Show Others check box.
- On the ribbon, in the View group, click Chart Wizard, then in the Chart Wizard window, under Construction, click down-pointing triangle in the Chart Type list, click Bar Series, and then click the Bar chart.